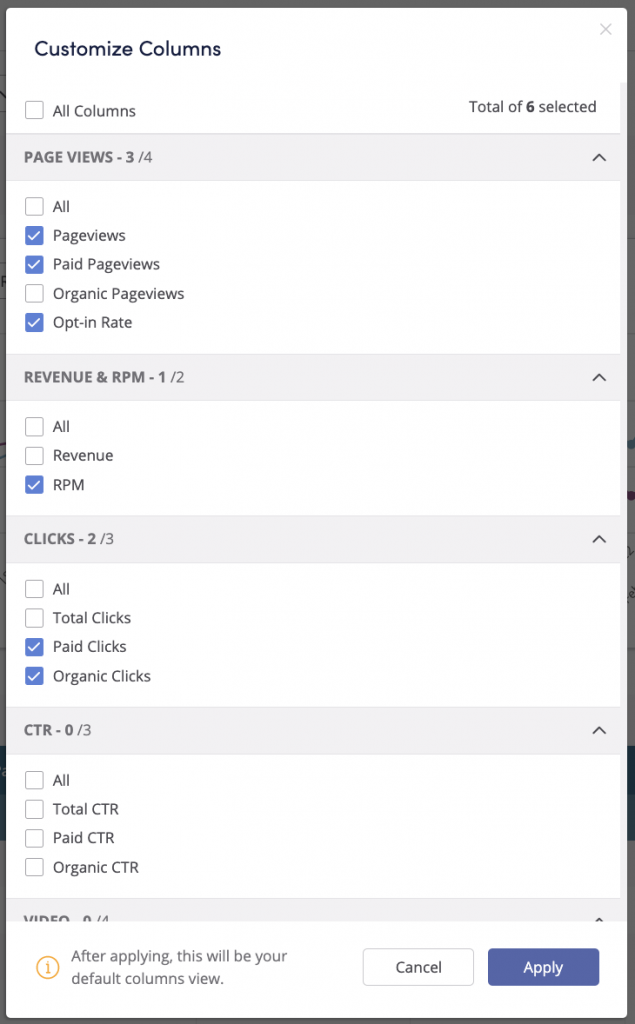
How do I customize my Performance Report?
Data is displayed in both chart and grid formats within the “Performance” tab of the “Reports” section.
You can customize the display of the data at 3 levels:
- Via “Breakdown” (top left corner)
Breakdown options include:
- By Day
- By Month
- By Platform – mobile, desktop etc
- By Referrer – how the traffic came to your sites
- By Country
- By Publisher
- By Section – view data by section of your site
- By Widget
- By Widget Combination – Beta – allows to determine widget groups (e.g: AR_1 + SB_1) to see the combined performances.
- By Position – performances per listing within a specific widget. Only available as a second breakdown if the first breakdown is “by widget”
2. Via the “Filter by” options (top left corner)
Using this feature you can filter in/out metrics which are greater than, lower than, in between or equal to certain metrics.

3. Via Customize columns (on the right, above the grids)


Need to know more about the Customise columns metrics? Please check this article.