Eye on Infographics: The Psychology of Visual Content

One unmistakable trend we see in business today is the increased use of visual content. For starters, most successful businesses have a website, which is a visual experience. And content strategies with strong visuals for widespread sharing have become crucial cornerstones for many marketers.
In fact, content with visuals gets 94% more views, and readers are 80% more likely to read information in the first place if visuals are involved.
Infographics have certainly taken off as a marketing strategy. Breaking into the mainstream earlier this decade, infographics are highly digestible, which is probably why many businesses still benefit from using them.
For fledgling, cash-strapped businesses that are trying to grow, infographics are a vital tool to generate traffic at an affordable rate. They are effective at grabbing the attention of your target audience and conveying information simply but effectively. The color and the visuals do the talking, leaving a lasting image in the target audience’s mind.
What makes infographics so successful?
Apart from the fact that we process information visually, 93% of all communication is nonverbal. Visual stimulation attracts our attention, affects our attitude and enhances our emotions.
The visual nature of infographics makes them effective because of how our brains are wired. Humans process images 60,000 times faster than texts, allowing for quick and efficient retention of information. When complex information is presented in an appealing way, it’s much easier to elicit recall and a reaction.
Given the choice between a research paper of black text on a white background vs. a colorful infographic, what would you choose? If it’s the text for some reason, you might run the risk of having to hit the snooze button.
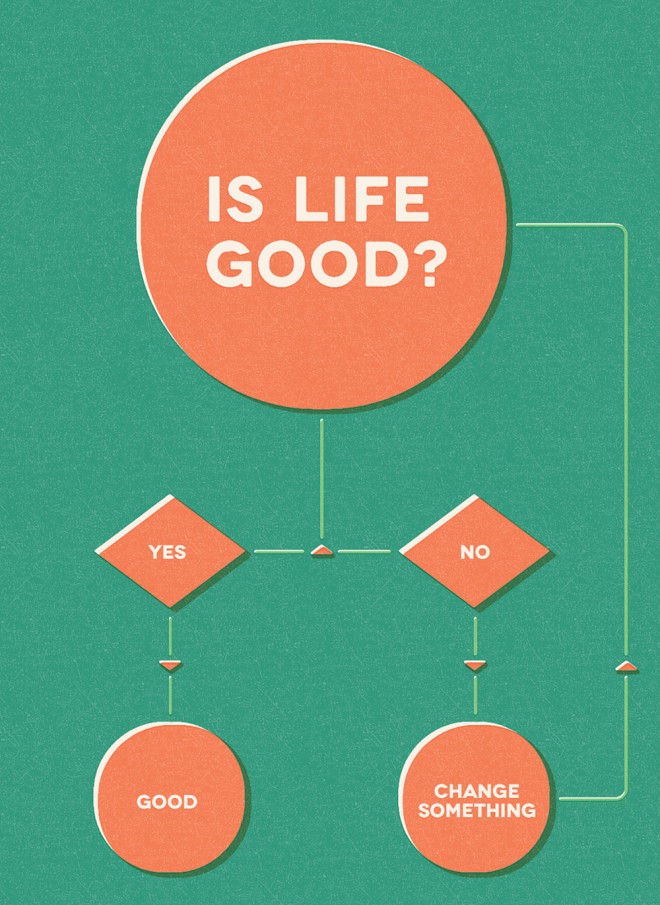
Visually stimulating doesn’t have to mean overwhelming. Many of the most powerful infographics still capture attention through their simplicity and minimalism.

Source: Wired
How to use infographics in marketing
Visualizing content has been an ongoing strategy for years. Infographics add new dimensions in shaping what a user perceives and provides fresh context. Written text sometimes may invoke imagery in the brain, but those images can be tailored and shaped better with infographics. By using appropriate visuals, infographics show relationships in data, hierarchy, geography, demography, and chronology.
The user can get immediate clarity on issues and form a more holistic image of the information presented in a fraction of the time it takes to read large amounts of text.

Source: Daily Infographic
Color psychology
How can marketers use the power of color to increase traffic and leverage content and products?
If you were to hear or read the words “yellow car,” for example, the first image that comes to mind is your personal version of a yellow car. For some it might be a Lamborghini, for others, it might be a Ford Explorer.
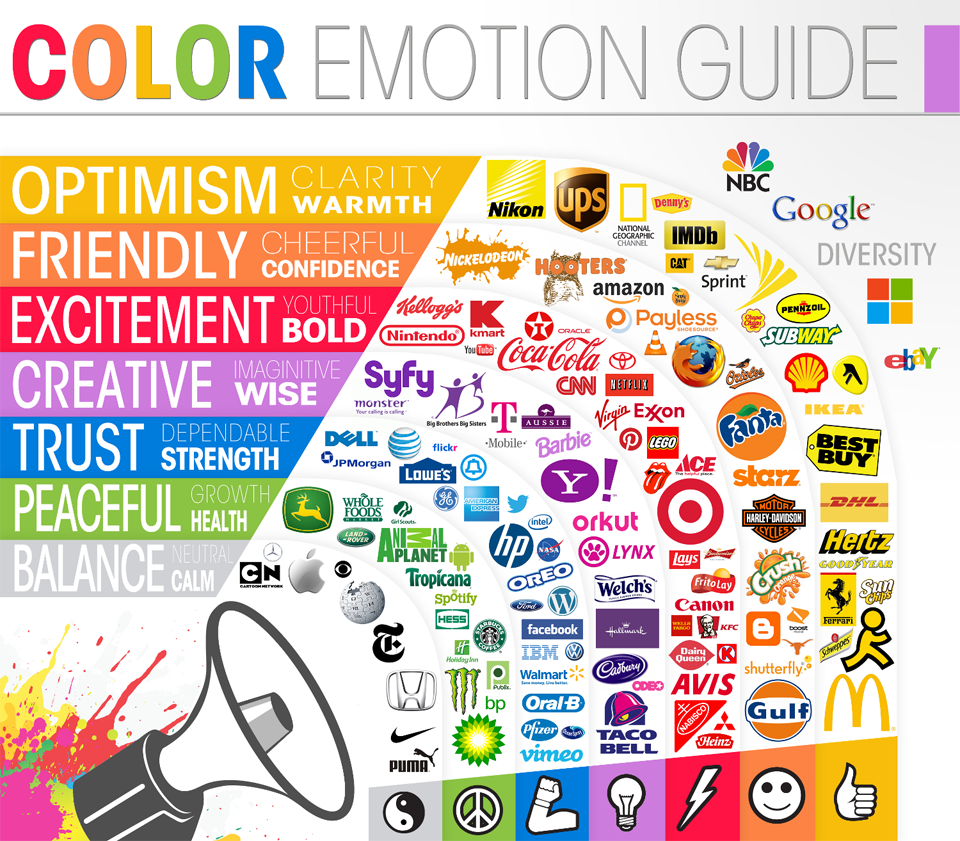
Color is an integral part of marketing, playing a bigger role in influencing our decisions than we would like to admit. Market research surrounding color psychology examines how color influences behavior, decision making and value association. Major brands like McDonald’s, Yahoo and many others have gone to great lengths to ensure that their branding uses the right color for the right market.
Shareability
New content gets added to the internet at a stunning rate of 2 million blog posts per day. That’s why creating infographics alone is not enough if you want to market successfully.
Research has shown that infographics are three times more likely to be shared than any other form of content on social media—but you will need the right strategy. For that reason, infographics need to be made shareable and marketed to other blogs.
Branding
Infographics are highly versatile and can be created to fit the needs of any target audience. And with an array of styles, fonts, color schemes and data visualizations, they can be designed to fit any brand. However, infographics need to be consistent with your branding.
Your audience might already be familiar with a certain style of writing or imagery in your other forms of marketing. Carrying that style to your infographics will promote familiarity.
SEO
Search engine optimization is a fundamental element that needs to be built into your design to make your brand visible. However, since infographics are essentially image files, normal SEO rules don’t apply.
The file name is one part of the infographic that tends to be overlooked. Search engines scan the file names to determine subject matter, so an infographic file name needs to be concise, yet descriptive. Image0034.jpg won’t get you very far.
Having a clear meta description, around 155 characters, is extremely important as well. Not only will it pop up under the search result, but it’s also the last piece of information viewers see before deciding to click.

Source: Backlinko
Repurposing blog posts
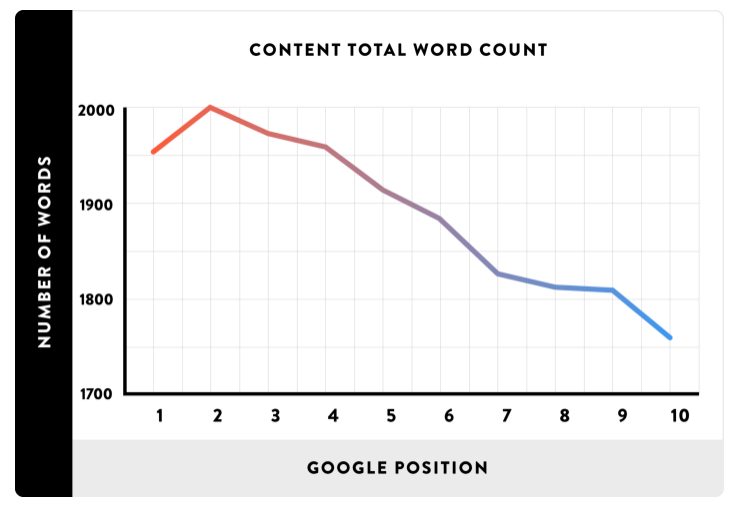
Just knocked out a 2,500-word in-depth blog post? This is relatively common practice to achieve a lot of organic traffic—especially considering the average first-page result is 1,890 words. High word count is often indicative of well researched in-depth coverage.
One way to leverage that content is to repurpose it into an infographic, which will grab the attention of the reader. The blog post can then be used to elaborate on what has already been presented.
Design
When designing your infographic, try to place the bulk of the text in the middle. It creates a subconscious frame around the actual information while the images and visual effects draw the reader’s attention.
Typography is another crucial element. Different types of fonts elicit different emotions and are commonly used for different purposes. When used creatively and appropriately, typography produces the feeling that your brand wants to project. And above all, the font must be readable.
Conclusion
When you think of memories that stand out, it’s rare that you’d imagine a block of floating text. Visuals allow for instant recall. So for the sake of your marketing strategy, remember to keep it visual.


