Bridging the Measurement Gap between Brand and Performance Marketing

How tall do you weigh?
I know, that question is complete nonsense.
Surprisingly, brand and performance marketers ask these types of apples to oranges questions every day.
- Our brand campaign has been running for a week, how many new customers do we have so far?
- How many sign-ups came from last week’s blog post?
- What’s the bounce rate on that infographic?
Speaking the Same Language
How do we get performance marketers to stop asking bottom-funnel focused questions about brand initiatives, and how do we get brand marketers to start speaking a language that will help performance marketers understand the impact of top-funnel activity?
The tracking of how top of funnel engagement impacts lower funnel activity is, of course, much easier said than done. It is, in fact, one of the toughest challenges marketers face in terms of deciding how much budget to allocate to different channels.
Understanding the marginal value that each marketing interaction contributed throughout the entire customer journey is the holy grail of marketing measurement.
Many advanced marketers are implementing costly cross-channel attribution and media mix solutions, but from my analysis of most offerings, the main problem with these solutions is that they still do not properly attribute the impact of upper funnel activities.
The reason is simple. Time.
The average time from when a consumer first engages with content discovery to the time she converts depends on the vertical, but the overall stat Outbrain is seeing is an average of 6-30 days, with high variance.
If a marketer wants to make real-time budgeting decisions based on data, waiting for the lion’s share of conversions to arrive is not a viable option.
This disconnect between top of funnel engagement and bottom of funnel conversions, leads to budgeting decisions favoring last click channels, instead of the channels and content that may be responsible for the consumer first becoming engaged with, and even admiring of, the brand.
Brand budgets are often not viewed as measurable drivers of growth because engagement metrics such as page and video views, time on page, scroll depth, and social shares lack a direct connection to monetary value.
This creates internal division between marketing departments that’s driven by people’s beliefs rather than real numbers.
An Outbrain Internal Case Study
We’ve faced this exact challenge internally at Outbrain with our user acquisition efforts. To bring the debates to an end, and align all our marketers to a single goal, we set out to answer one simple question that would let us assess the value of our content marketing activities in real time:
What is the expected future conversion value of an engaged user?
To answer that question, we did the following:
- Defined what engagement means for each piece of content we own
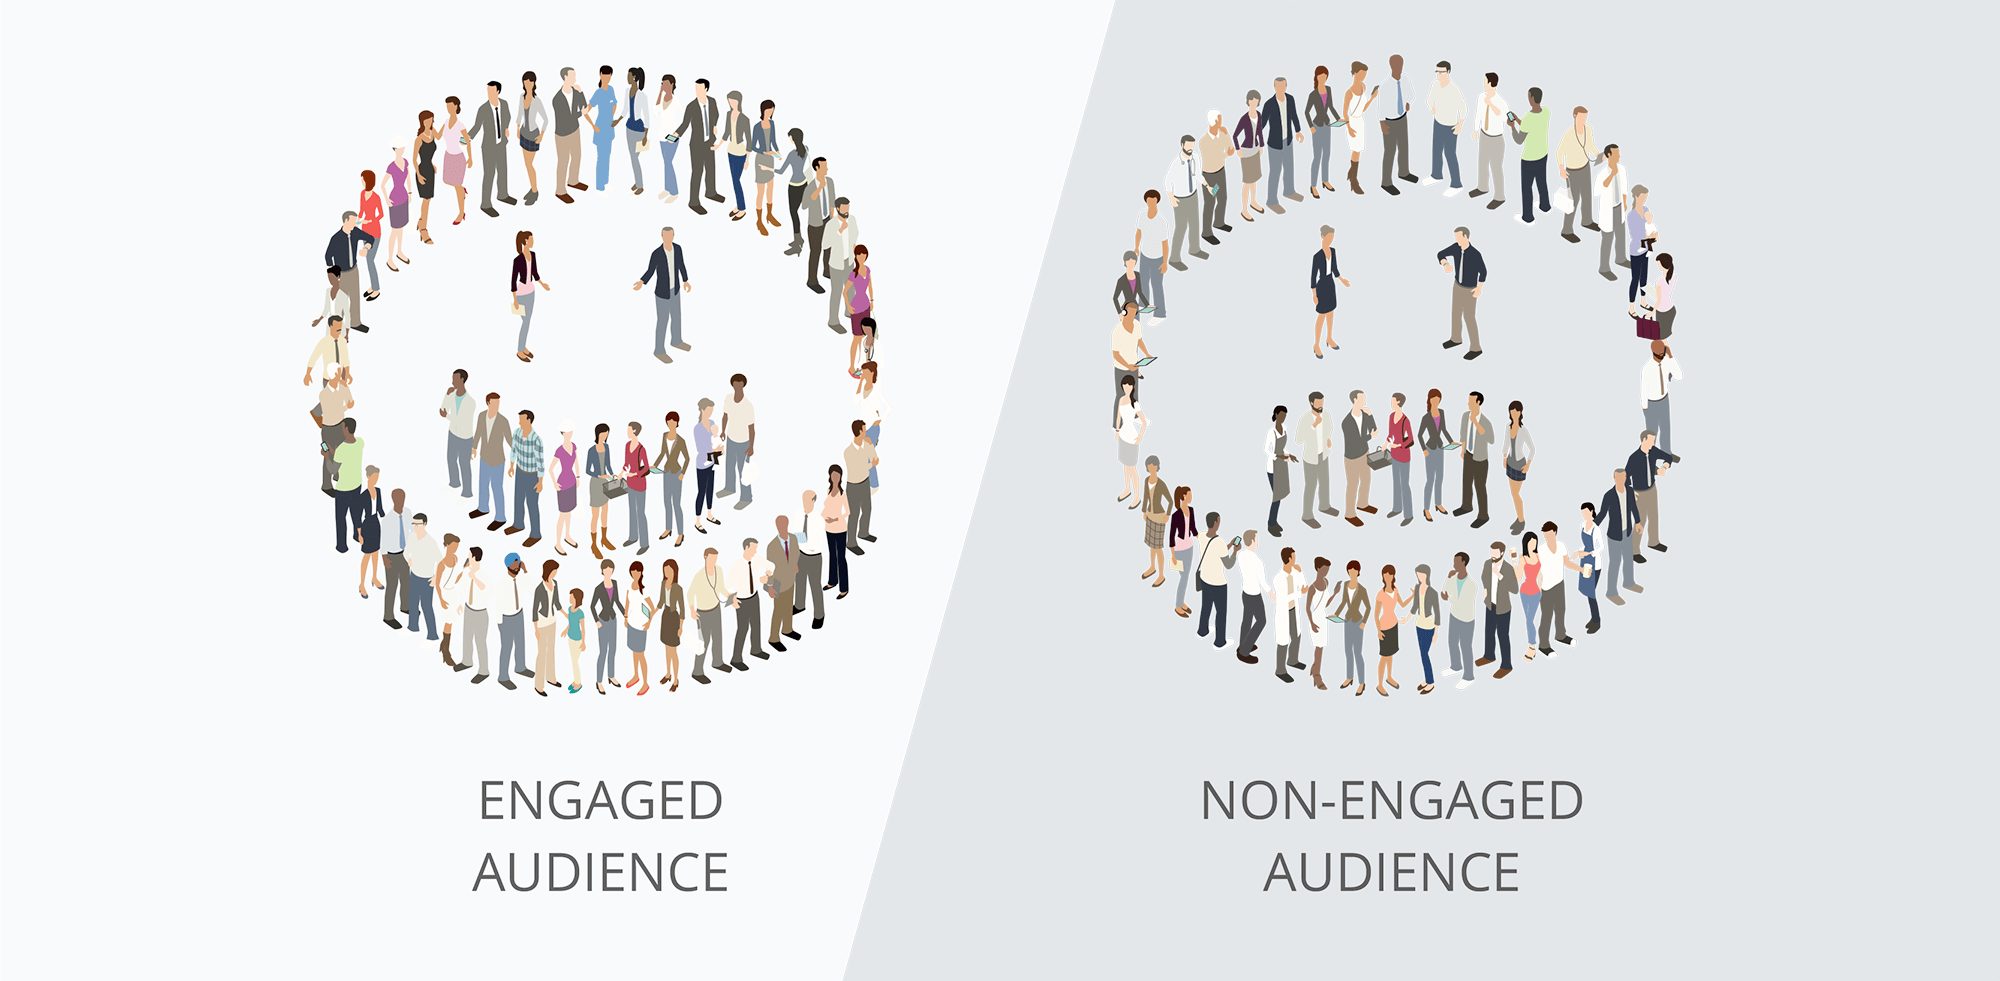
- Divided our audience to engaged and non-engaged users
- Measured the performance of the two groups by re-engaging each of them with lower funnel content.

To measure engagement with a piece of content we created an external script which checked 3 different metrics for each content visitor:
- Time on page
- Scroll depth
- Number of page visits during a single session
Whenever the visitor achieved all three of the minimum engagement levels, the “engagement pixel” was triggered. The engagement pixel then triggered both the Facebook and Outbrain custom audience pixels, allowing us to retarget the engaged visitors and the non-engaged visitors in separate groups at the same time with the same piece of lower funnel content.
Lower funnel content for one of our target personas is a marketer looking to get started with content marketing, so we drove both groups to this post, 4 Simple Ways to Understand and Execute Content Marketing.
The Results
The campaigns that targeted only the engaged users had an astounding 50% lower cost per acquisition than the campaigns that targeted the non-engaged users. This significant difference in cost immediately credits value to content that is more engaging. Great content matters for your bottom line!
Now that we know the expected value of an engaged user we’re able to define the expected CPA of all our upper funnel campaigns in real-time and adjust our spend and cost-per-click (CPC) accordingly to meet our overall target CPA.
Targeting the engaged users also resulted in a 28% lower cost-per lead (CPL), a 52% higher click-through rate (CTR), 55% more social activity, and 63% more time on site.
A Common Language of Currency
Our SVP of Strategy, Gilad de Vries, mentioned the growing importance of cost per engagement (CPE) for content marketers in 2016. We’re seeing this now, as our brand, content, and performance marketers are now able to come to the table speaking a common language of currency. That currency is two fold:
- Cost Per Engagement
- Expected Cost Per Acquisition
More engagement results in lower CPE which leads to a lower expected CPA. Focusing on a common language of currency allows alignment to both a great content experience, as well as hitting our target CPA.
It’s time to get all your marketers on the same page. Unite your brand and performance marketing by measuring the value of an engaged user. Optimize from discovery to conversion and make every dollar spent work harder across the entire customer journey.
For an in-depth post on how to fire an engagement pixel that combines multiple engagement metrics, subscribe to our weekly newsletter, as we’ll be sharing instructions soon.


