[Interactive] Outbrain Affinity Index: Uncovering Discovery Moments Across the Content Spectrum

By providing 250 billion tailored recommendations each month to around one billion unique users worldwide, Outbrain is uniquely positioned to uncover the interests of internet users and to reveal “Discovery Moments”* from across its proprietary network.
To give life to some of these billions of data points and insights into the Discovery patterns of Internet users, Outbrain has teamed with France-based human-data interaction specialist, Dataveyes. This interactive data visualization application displays affinity data from both desktop and mobile audiences across a defined set of vertical sectors. The information is based on Outbrain data collected in 15 countries during 2016.
Insights are organized into 11 main categories—Auto, Travel, Business & Finance, News, Entertainment, Health, Home & Lifestyle, Sports, Electronics & Tech, Travel and Food—which are then further broken down into 88 subcategories.
Each category corresponds to an affinity index, which measures the relationship between the theme of an Outbrain recommendation and the theme accessed by the user on the page of a media site.
This level of granularity provides deep and sometimes surprising insights and can be drawn upon by advertisers that want to understand the interests of their audiences and, ultimately, better inform how they think about their content and messaging strategies.
Take the Auto sector, for example.
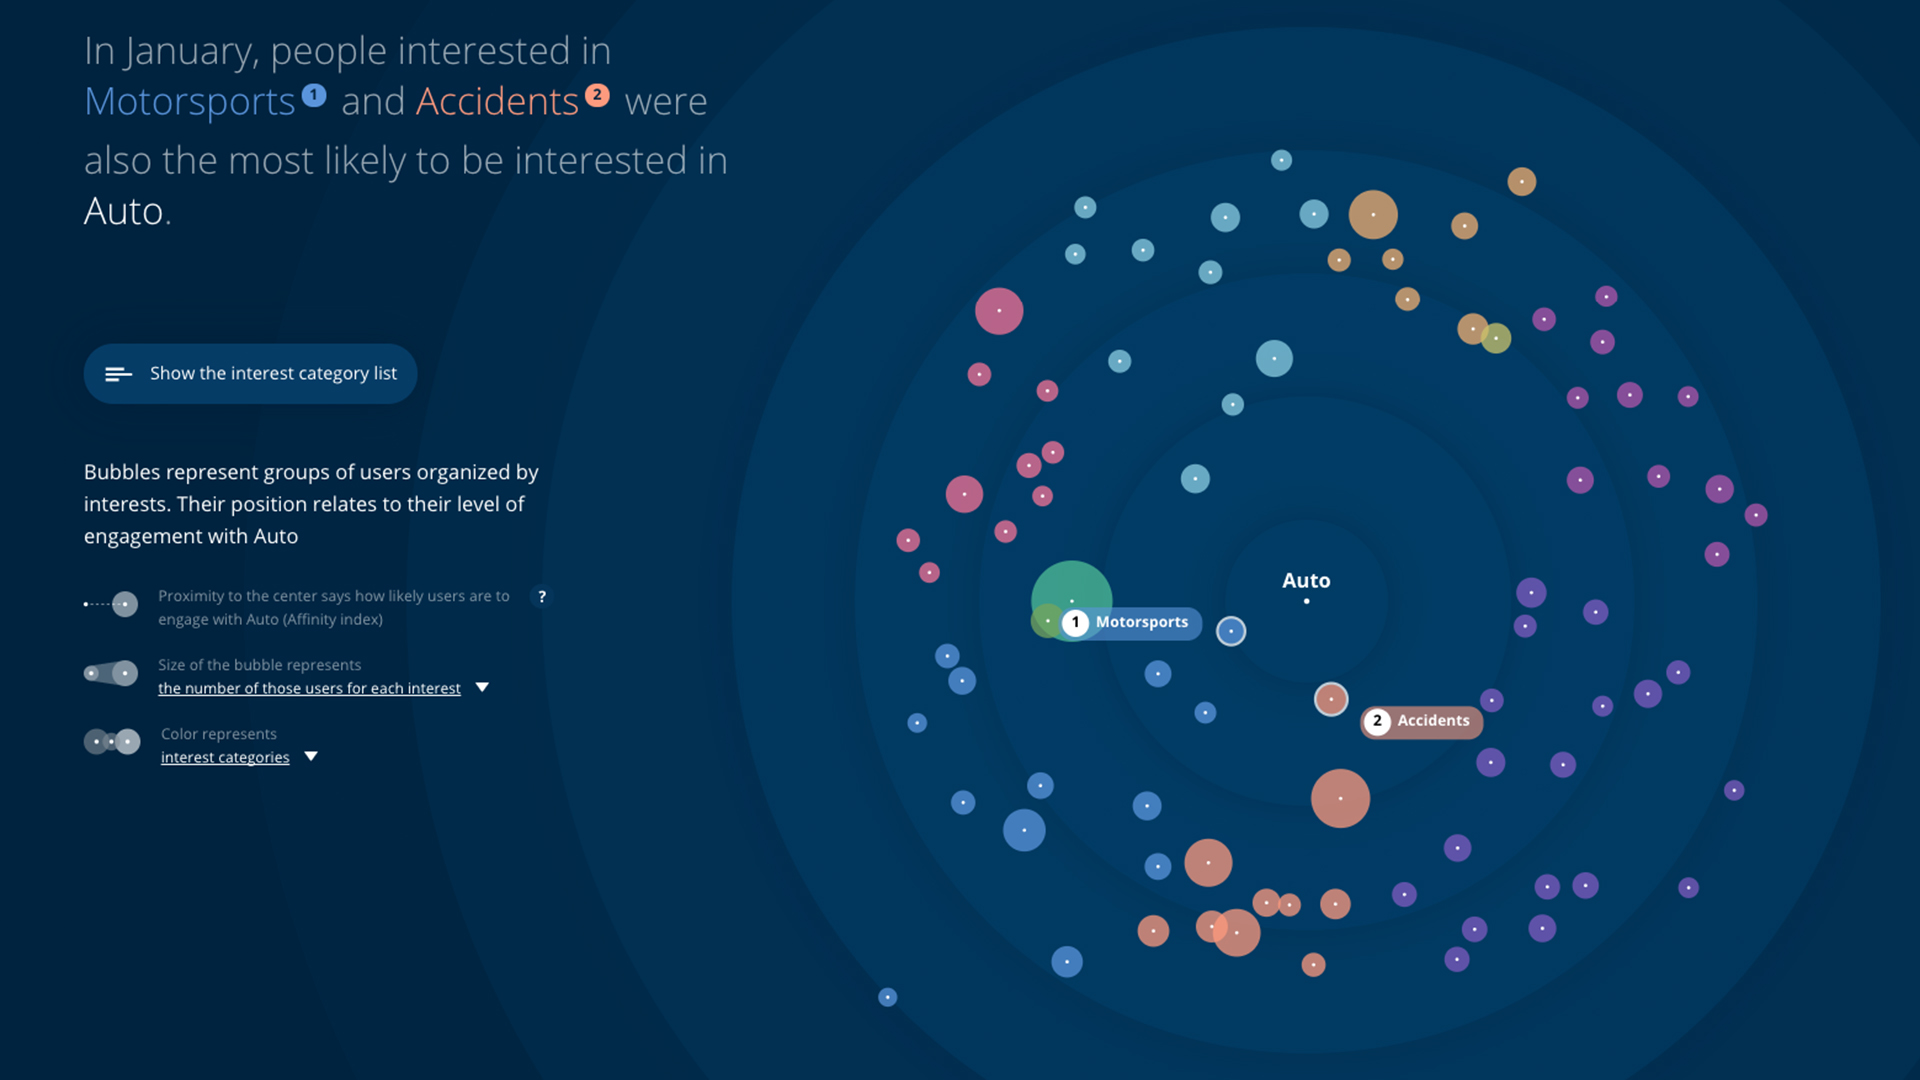
In 2016, Outbrain delivered 47 billion related recommendations to US internet users. In January 2016, when the weather turned chilly and roads became icy, people reading about Motorsports and Accidents were the most likely to also select Auto-related stories—a full 3.1 billion of them. That makes a lot of sense as there is a clear, logical link between those topics.
In August, however, those who were reading about Software and Boating were the most likely to also read Auto stories (3.7 billion). That connection may seem less obvious but is equally strong.
By understanding how different audiences respond during various times of the year, automotive advertisers will be able tailor their content development strategies accordingly.
Here are some examples of other connections that are strong although less obvious:
- People reading about Small Business and Hardware were the most likely to click on Discovery campaigns about Health (October 2016).
- Those reading about Auto and Banking were the most likely to also click on Discovery campaigns about Entertainment (February 2016).
- Those reading about Boating and Natural Disasters were the most likely to also click on Discovery campaigns about Electronics and Tech (August 2016).
- Those reading about Auto and Crime were the most likely to also click on Discovery campaigns about Sports (January 2016).
Even at the subcategory level, there are correlations that marketers might not be aware of that they can use to their advantage when developing content:
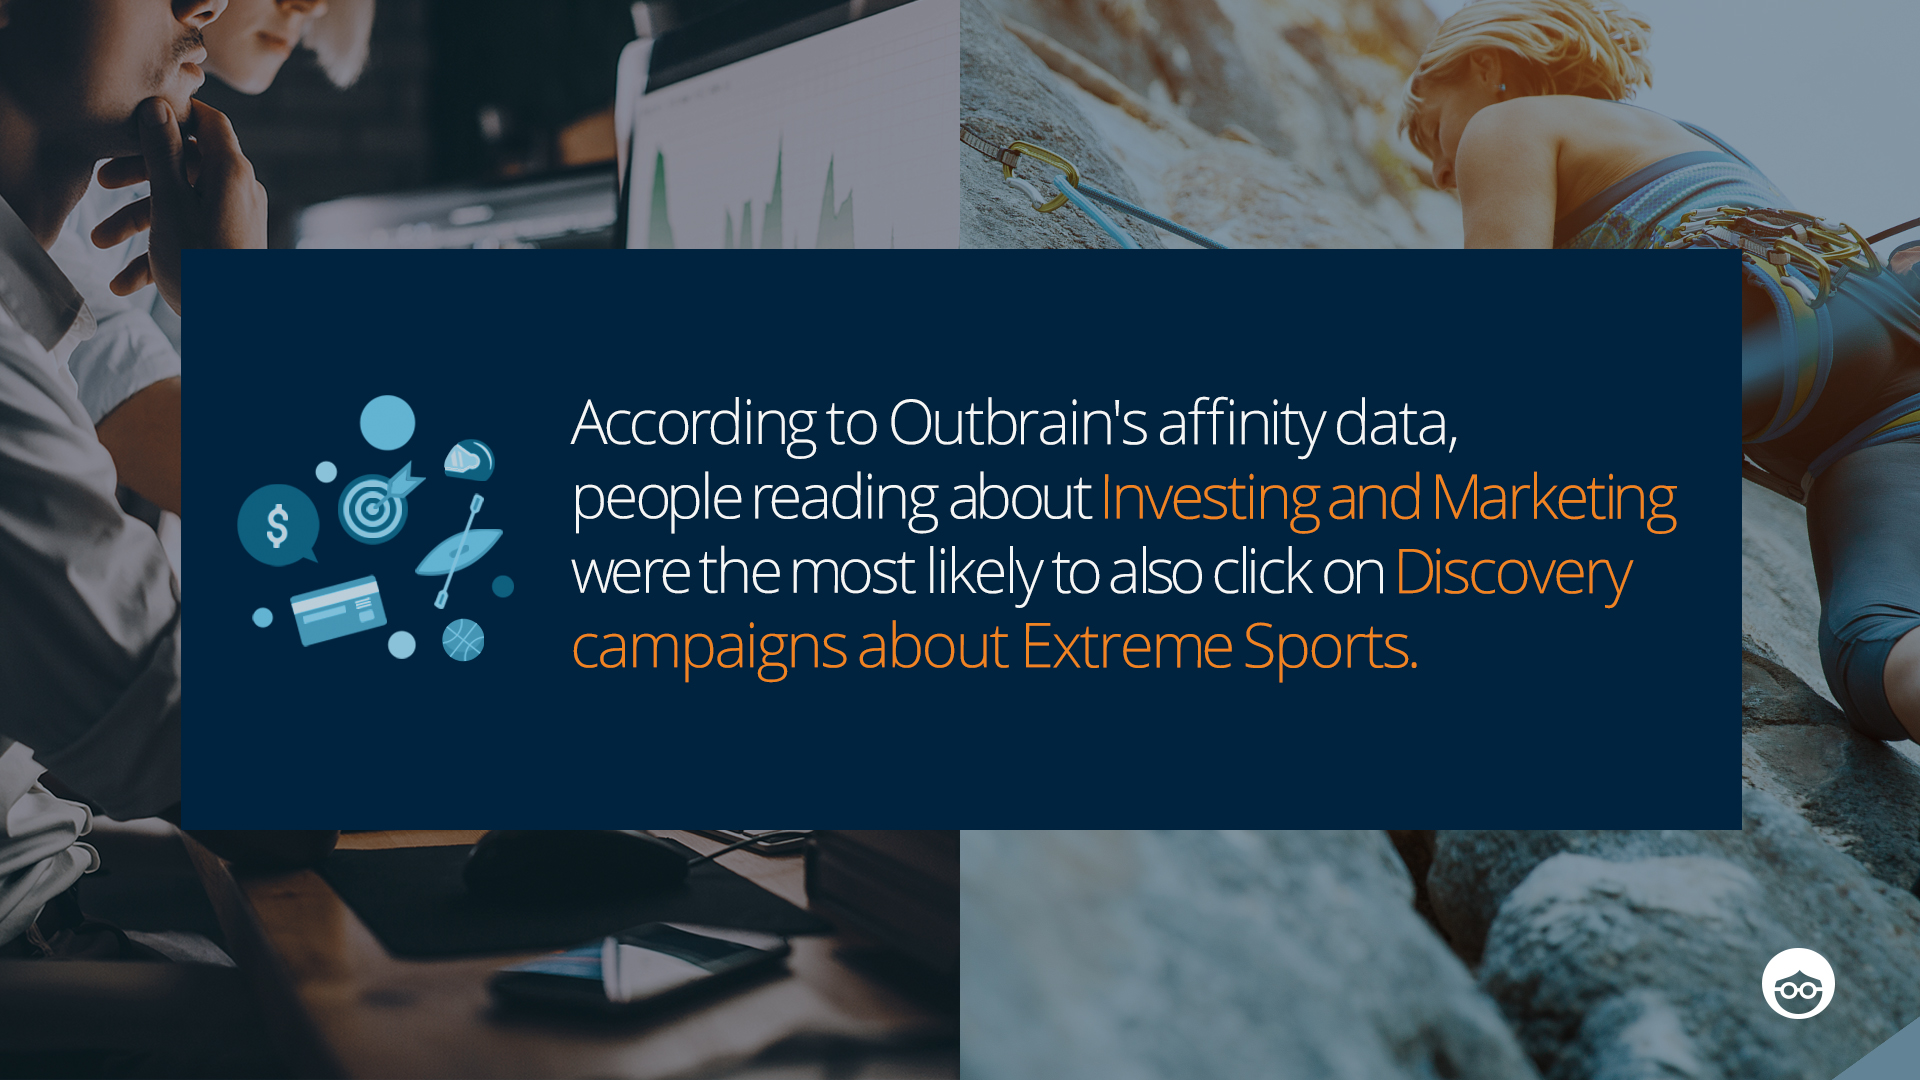
- People reading about Investing and Marketing were the most likely to also click on Discovery campaigns about Extreme Sports (January 2016).
- Those reading about Real Estate and Science were the most likely to also click on Discovery campaigns about Cameras (May 2016).
- Those reading about Gaming Systems and Small Business were the most likely to also click on Discovery campaigns about Aging (November 2016).
“Our ambition is to invent new visual languages to translate data into information, and ultimately to serve a better understanding of our everyday world,” noted Caroline Goulard, co-founder of Dataveyes. “This is what the unique dataset from Outbrain allowed us to do: to tell a new story about the interests of internet users. ”
Keith Pepper, Country Manager, North America at Outbrain, concluded: “With Dataveyes, we wanted to offer advertisers insight into the ‘Discovery moments’ of their target audiences through a visualization that makes accessible and digestible some of the vast unique data we hold.”
* The contexts and environments when audiences are most likely to act.


