3 Secret Content Marketing Metrics Performance Marketers Use

Every marketer knows how important it is to track and measure marketing campaigns. Being able to evaluate your content marketing activity, from campaign creation until ROI, is critical to iterating its success. But in today’s competitive industry it’s not enough just to measure click-throughs or conversions, today’s marketer has to be smart and creative in order to stay ahead of the curve.
If you want to extract the most out of content marketing you need to stop crunching the standard metrics such as CTRs and conversion and look to more unique metrics that can provide you with a more detailed picture of the customer journey.
Similar to PPC or social marketing, there are generic metrics, aka vanity metrics, and then there are custom metrics which will often provide much more value. While the best metrics for your business will depend on the industry and KPIs, in this post, I’m going to reveal 3 important metrics that performance content marketing can use to optimize their marketing campaigns:
CVPI (ConVersion Per Impression)
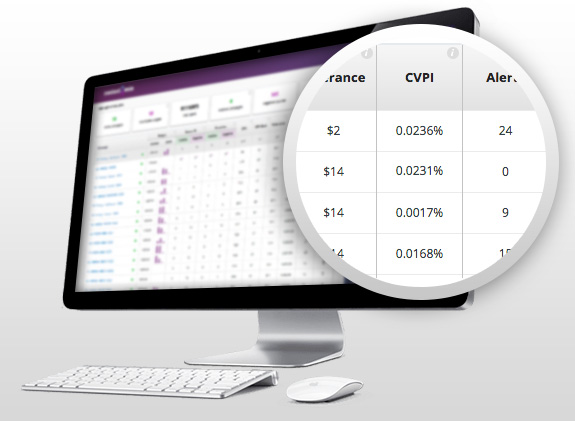
This metric shows the ratio between impressions and conversions.
Every time your ad is displayed, you have a chance of getting a conversion. Sure, your readers first have to click the ad, but measuring from the impression shows you the total conversions possible according to your reach on the network. It also eliminates from the equation the price you are paying for that click (CPC Bid) which can fluctuate as you play with your bids to increase/decrease your traffic.
Calculation – Conversions / Impressions X 100
Great to use when you want to know which ads lead to the most possible conversions. It takes into account your Click-through Rate (CTR) and your Conversion Rate (CV). Furthermore, as the CTR metric is classed as a major influencer in Outbrain’s RPM calculation, the CVPI metric will help to show you which ad is providing the most conversions (which you as an advertiser would want) while maintaining a competitive CTR (which is best on Outbrain). By using the CVPI you can quickly scale up on the Ad by adjusting your daily budget and also determine the good Ads from the Bad – allowing you to create variations around them.
 |
The one downfall of CVPI is that it doesn’t care about revenue or if you need conversions to be below a specific cap. For example, you might have a specific lead quota or price level (CPA) that you cannot exceed. In those type of scenarios, it is best to use combinations for example CPA goals with CVPI to optimize your campaigns.
RPC (Revenue Per Click)
Unlike the CPC metric which basically shows you how much money you are spending per click, the RPC metric shows you how much money you are actually making. The RPC easily allows you to discover which campaigns, ads, and sources are generating profits and which need to be optimized.
Calculation – Revenue x (Click / Conversions x100)
For example, you might see a CPC of $0.33 with a click-through rate (CTR) of 0.27%, but when looking at your RPC, you might see that it’s $0.31, which means you are barely covering your marketing costs. In this case, you will probably have to alter your Ads, block sources, optimize your pages, or even test new landing pages or forms.
On the flip side, if your RPC is $2.30, this means you are way in the green! In this case, you’d probably want to duplicate the good ad and whole conversion funnel or try to create similar concepts around that profitable one.
LCV – (Late ConVersions)
The most common practice with content distribution platforms such as Outbrain is to initiate a campaign and then rapidly block non-effective sources as quickly as possible. Think about it, you are running across thousands of publisher sites. The only mistake that a marketer can make with this method is blocking sources based on spend, and then forgetting to check whether or not they were cost effective (ROI).
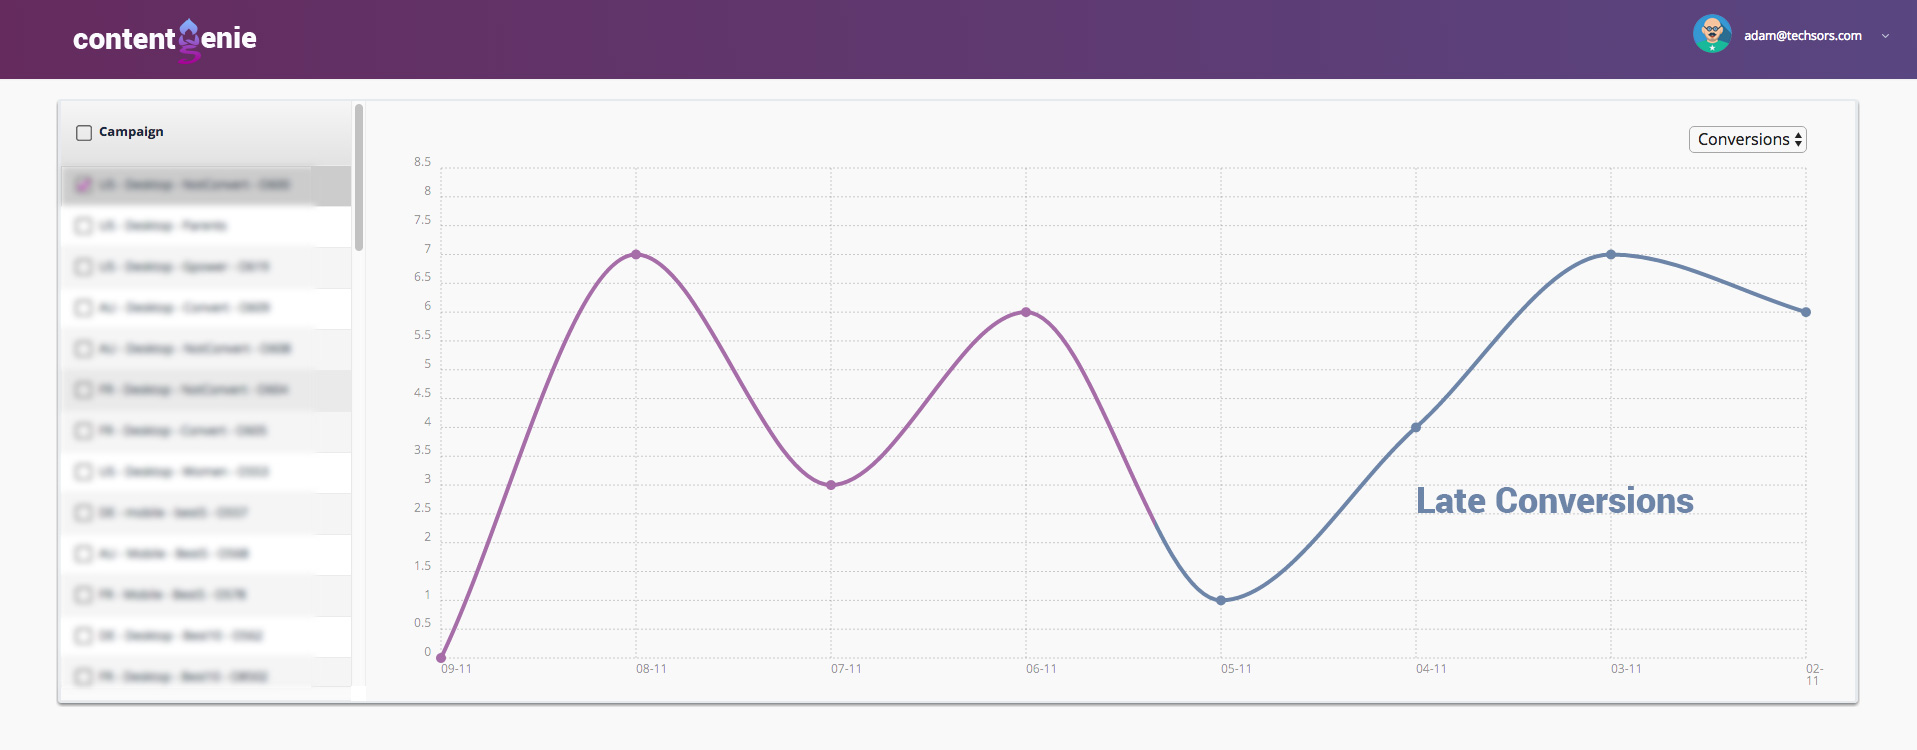
In my previous article, I mentioned that conversions do not always appear immediately. Depending on the vertical, I have witnessed conversions that arrive even 2 weeks after the user clicked on the ad. Marketers tend to stop a source due to it spending costs with no conversions, only for the conversions to appear at a later stage in the campaign.
 |
It’s important to note that sources which are initially negative can often flip to positive.
The idea behind the late conversion metric is to measure conversions from the time you stop a source, allowing that source to prove itself and evolve.
Final Note
Each of the metrics above provide excellent guidance, but they should be used alongside standard metrics and used in accordance with your business logics as well as your specific KPIs. The goal is to make use of the insights extracted from the data these metrics provide, allowing an opportunity to create longer lasting, more cost-efficient, and successful campaigns.


