Leveraging Your Video Analytics: Mining the Outbrain YouTube Channel

YouTube is still the second largest search engine in the world, and with the rising importance of video marketing, you want to be able to make the most of your experience on the platform.
The only way to really know if you’re doing that is by diving into your video analytics, which can be overwhelming because you have so many options.
More importantly, it’s hard to navigate through those options and draw insights that you can measure against your KPIs.
In order to be successful, it’s important to use several different data points and reports wisely, as well as know how they work together.
YouTube recently updated their report names and did some regrouping, so we’ll focus on the two major headings they clearly want us to pay attention to, and those are:
– Watch Time Reports
– Engagement Reports
Let’s dive into the tools and features you can use to analyze your own videos, mining some Outbrain examples for inspiration.
Some of the KPIs we measure and will cover in this article include:
– Estimated Minutes Watched
– Average View Duration
– Sharing
– Playback Locations
– Subscribers
– Views
The Timeframe Feature
It’s simple enough to set a timeframe when looking at your metrics, but how can it help us quantify our data, making it a little easier to draw conclusions?
Using the feature: Longer timeframes will represent how your channel is doing as a whole while shorter timeframes can represent specific campaigns or help you report on month-over-month KPIs.
Set a short timeframe if you’ve just uploaded something new or made changes.
Looking at the overall analytics across a 7 day period from a video published back in September, here are the insights we used to drive decision making around the content:
Because it showed positive trending signs after its first week, we made sure to ramp up promotion of the video via amplification to capitalize on its momentum.
Granted you promote a piece of content properly, even in a short week you’ll be able to gauge how the content is trending, helping determine what micro-level adjustments you can make to ensure your content effectively takes off.
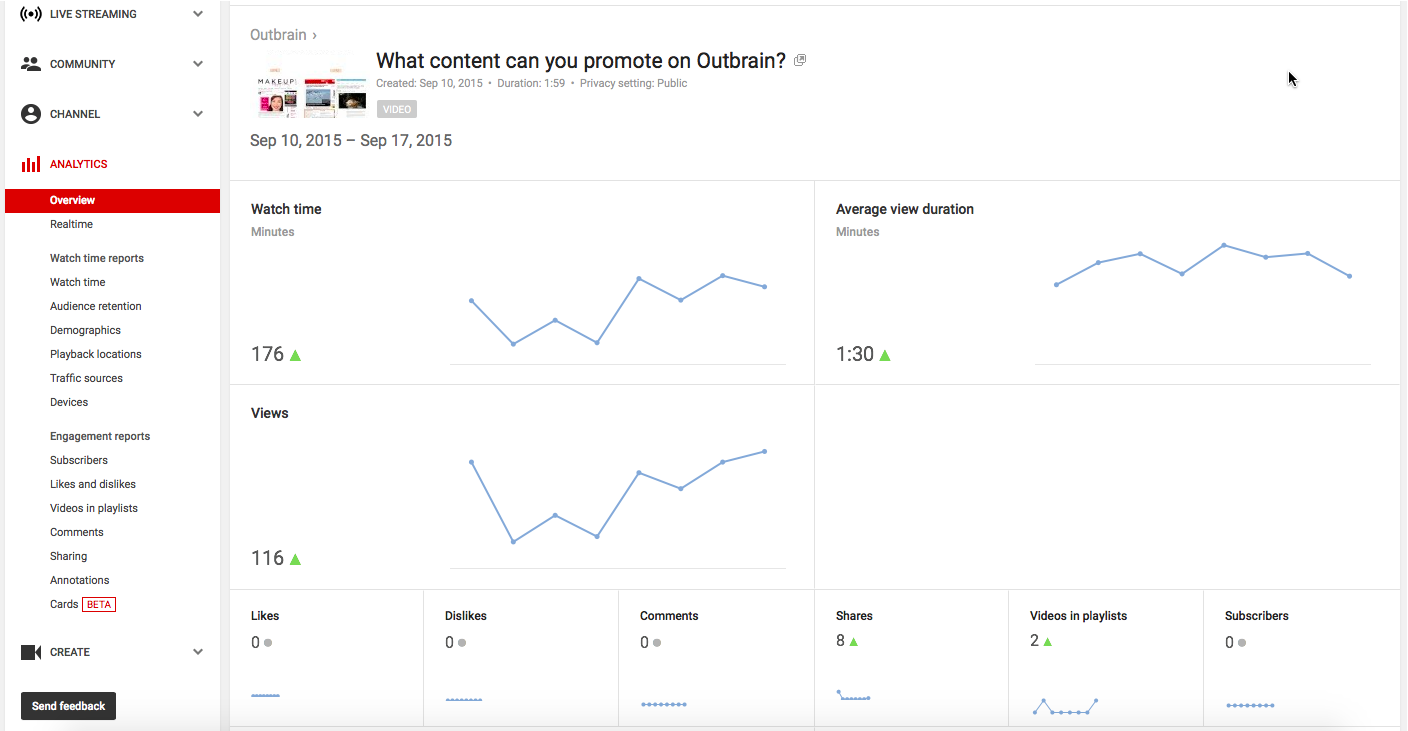
Set a long timeframe in order to see how your engagement is moving overall.
It takes time to see real concrete results; so looking at a one-month timeframe will give you a better indication of overall success when looking at the metrics.
Using the same example from above, we took a look at how the video published at the beginning of September was doing into October.
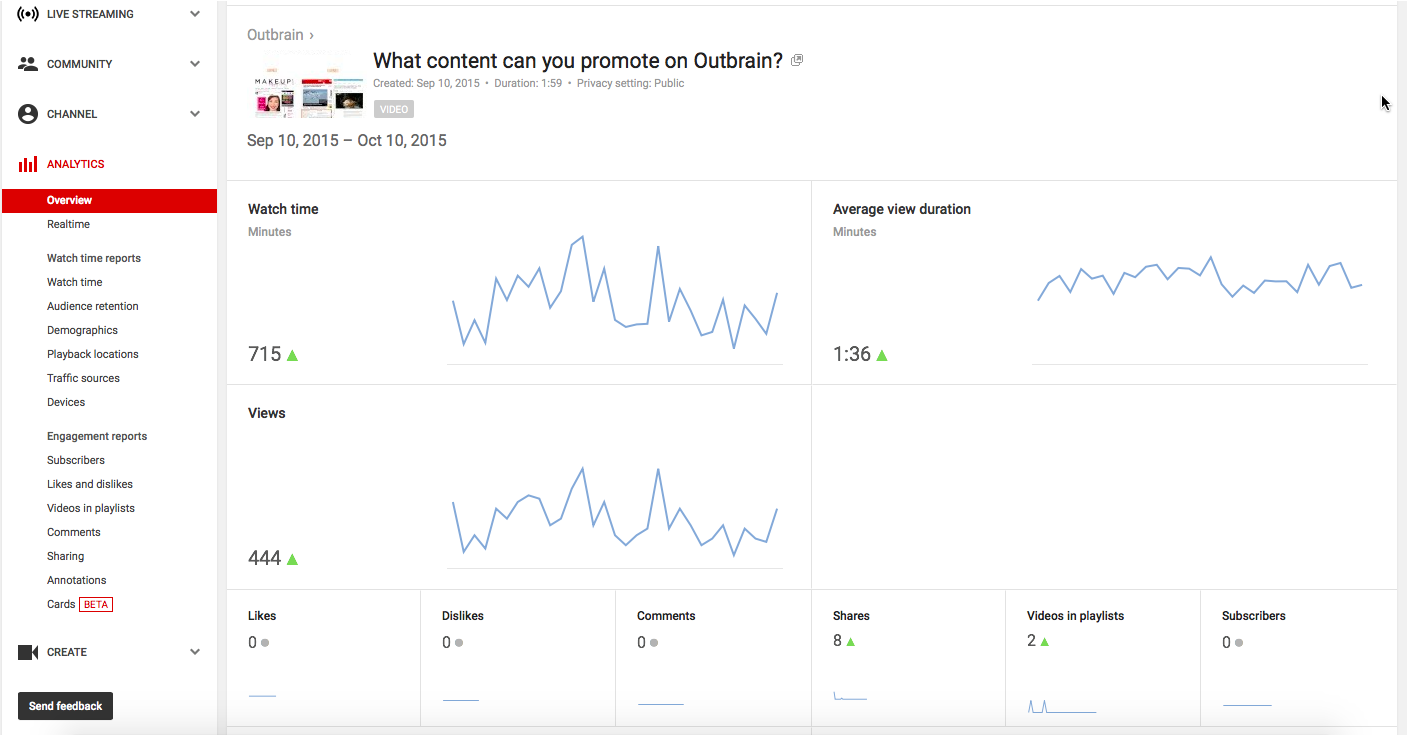
As you can see, even with some fluctuation it was still showing positive signs of trending.
Drilling down further, we compared watch time against average view duration, finding that as watch time dipped and spiked throughout, average view duration on the video remained strong.
That’s a great indicator of performance.

Thankfully, in our case, we were able to use this content as a benchmark for success, replicating its format for future video production.
Some details we noted:
– The content answered an important customer question
– The content was under 2 minutes long
– The content was informative
– The content provided visual examples
– The content promoted viewers with a CTA
It may take an extended period of time to compile and answer all of the questions you may have about your video content’s performance, which is why you really need to ramp up reporting on short term and long term data points.
The Comparison Feature
If you haven’t gotten the hang of reporting all of your YouTube activity, the comparison feature allows quick access to some direct correlations you can use to make data-driven decisions.
Consider the screenshot below, where we compared metrics from two separate quarters:
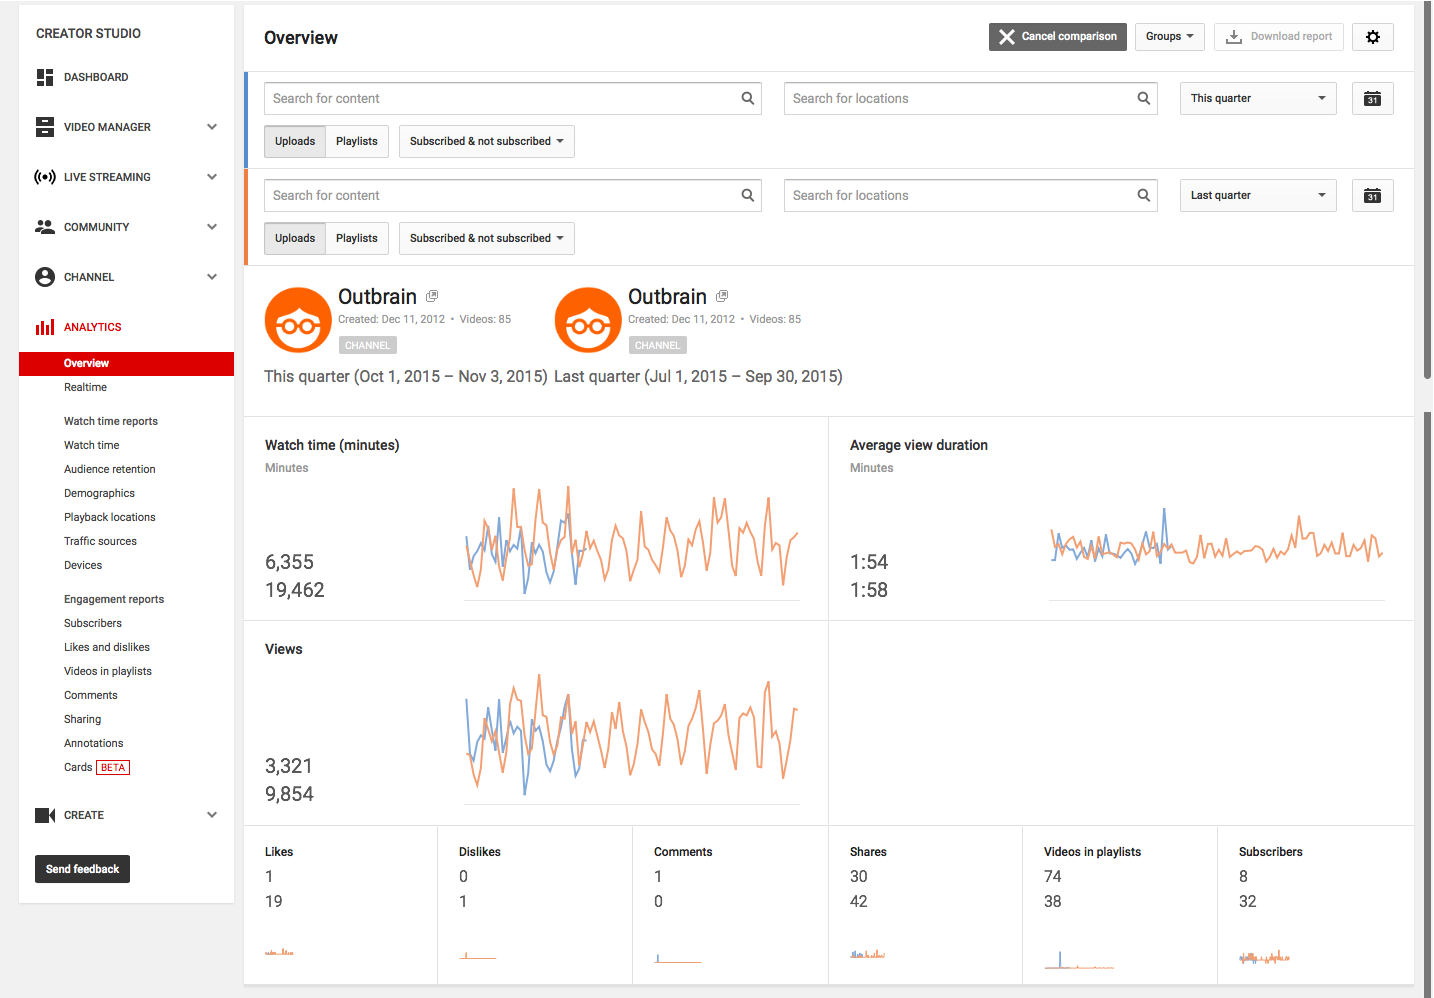
Using the feature: If you’re a social media marketer strapped with the objective of increasing channel growth and engagement, this is a great tool to reflect on whether or not you’re meeting quarterly goals.
For example, YouTube allows you to follow the shares taking place on certain videos.
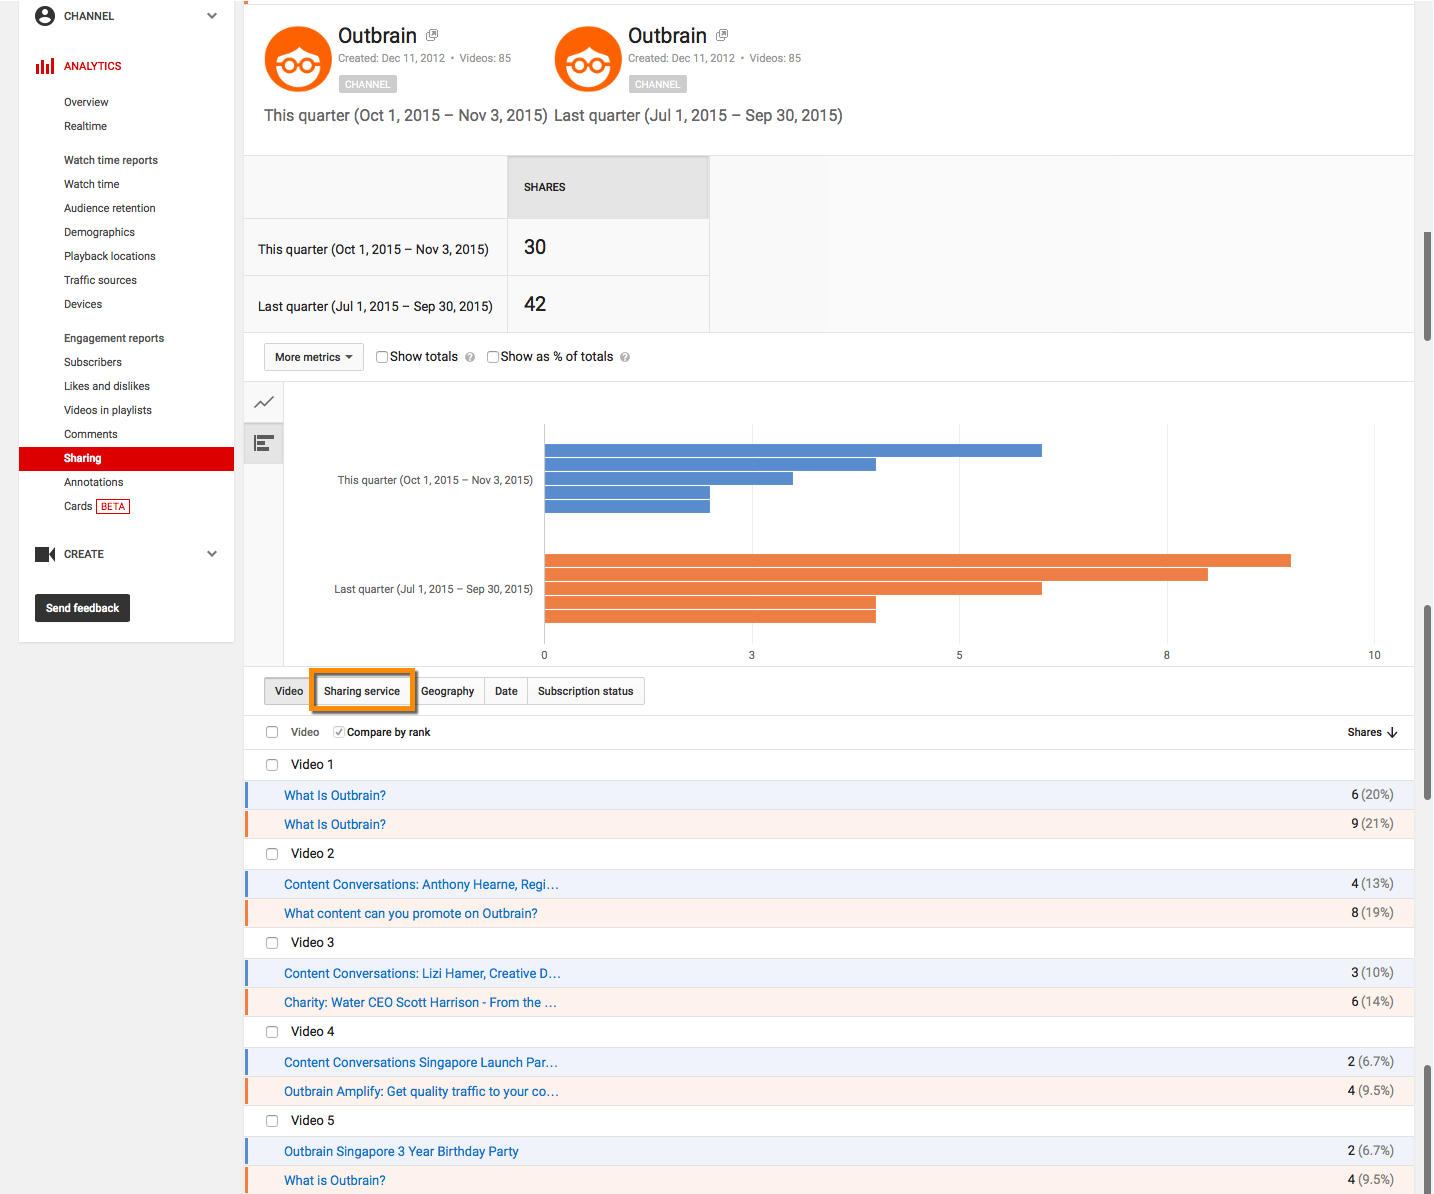
Not only did we discover what our most share-worthy content was, by clicking over to the sharing service tab, we got a breakdown of how audiences were actually spreading the content.
Turns out a large portion were copying the link to their clipboard:
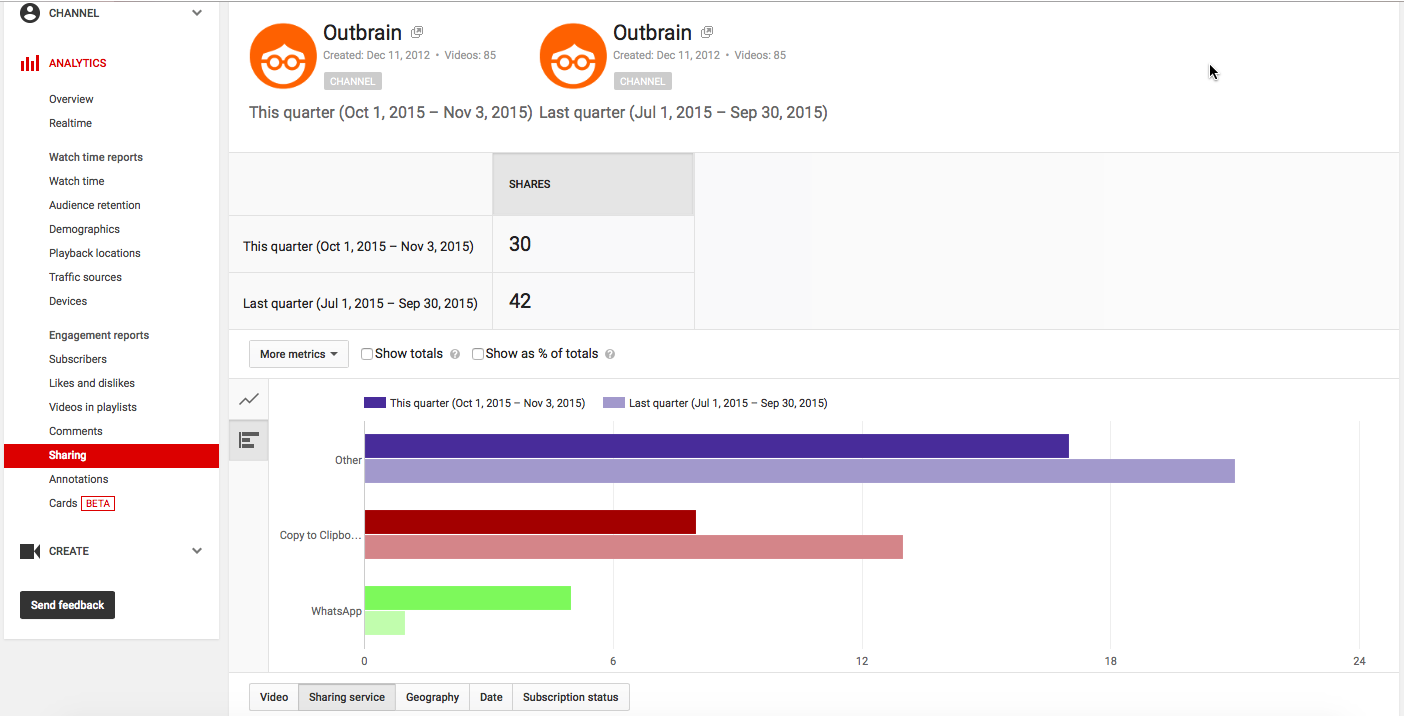
That’s a valuable insight about how users are interacting with our content.
Because most video content we release is distributed via email, we took this info and actually used it to optimize our outreach efforts for ease of shareability.
By ensuring that video links were strategically placed and tagged within each email, we would direct readers to share from their own inbox as opposed to copying, pasting and sharing a link we couldn’t continue to track after the user had clicked away to YouTube.
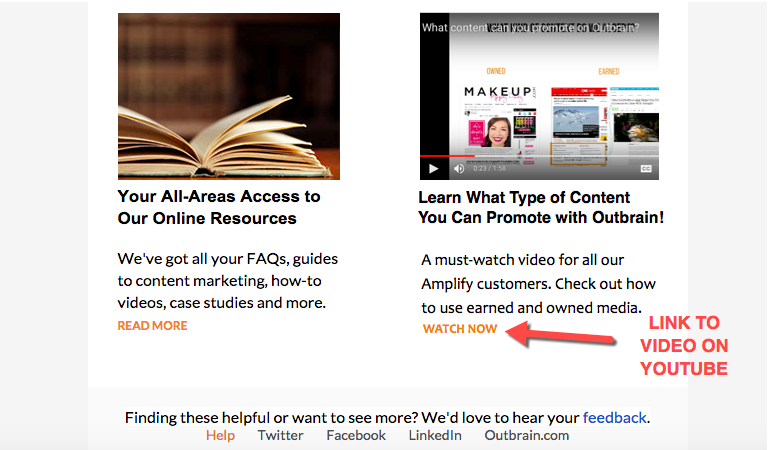
In time, the number of video links being copied to users’ clipboards decreased, and we were able to more accurately attribute sharing and properly measure KPIs.
Traffic Sources
Ever wonder where all your YouTube views are coming from?
You work so hard for them, so determining the fruit of your labor will be especially important for you with this report.
We wanted to interpret data for the “Lifetime” of our channel, allowing us to get a fair assessment of top traffic sources and playback location classifications.
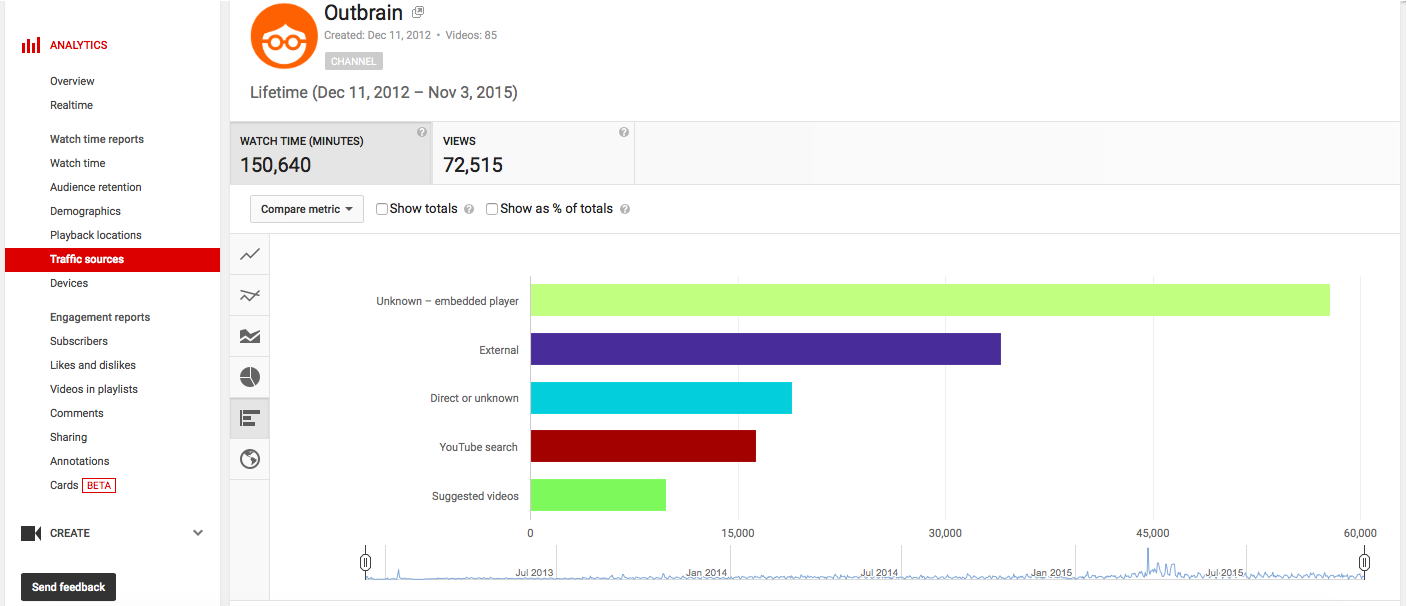
Using the report: Using the screenshot above for reference, we noticed that video embeds are the largest source for traffic on our videos.
For example, that could mean a video embedded on a Forbes article or in one of our own blog posts.
To see which specific sites are embedding your videos, check the playback locations report for an individual video, making sure to click on the “Embedded in external websites and apps” link in the list.
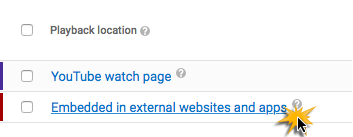
If you’re noticing that you’re getting a lot of attention from a particular site, make sure to give them a heads up when new content comes out by asking them to subscribe to your channel.
You can also use annotations and YouTube cards to capture viewers watching on embedded players.
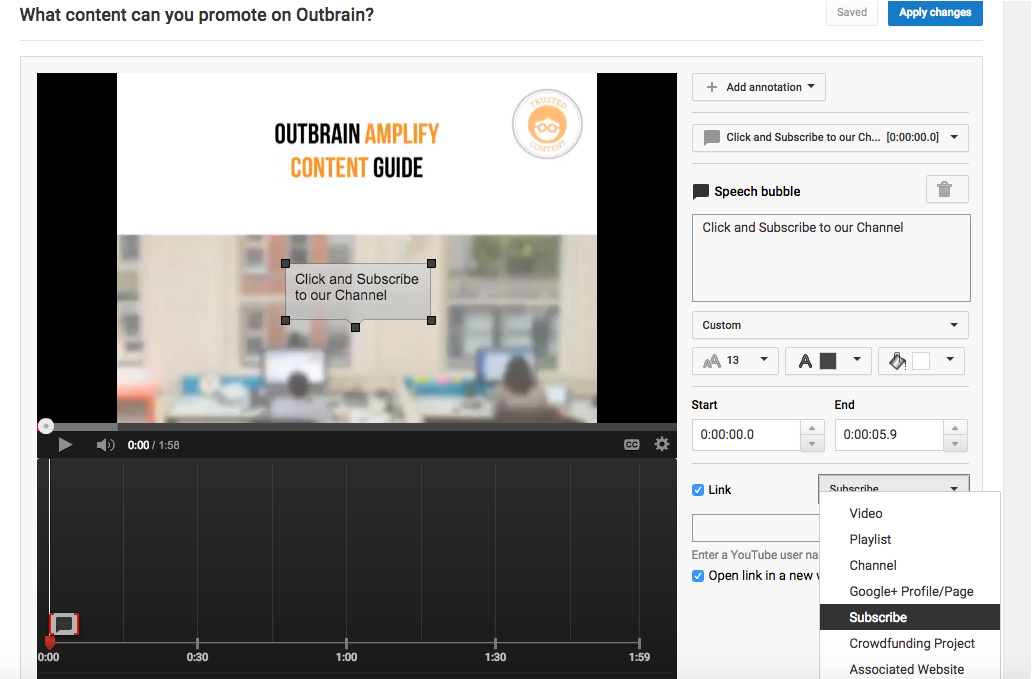
This simple trick makes it incredibly easy to convert viewers into new subscribers right from where they are consuming your content.
Below, what the user will send when they click on the annotation you’ve set up to gain subscriptions:
Demographics
Knowing the demographics of your viewers can help you understand how you should be creating your content–relevant to both gender and location.
As you can see from the screenshot below while the largest part of our viewership is in the United States, Israel proves to be a legitimate fanbase for our content:
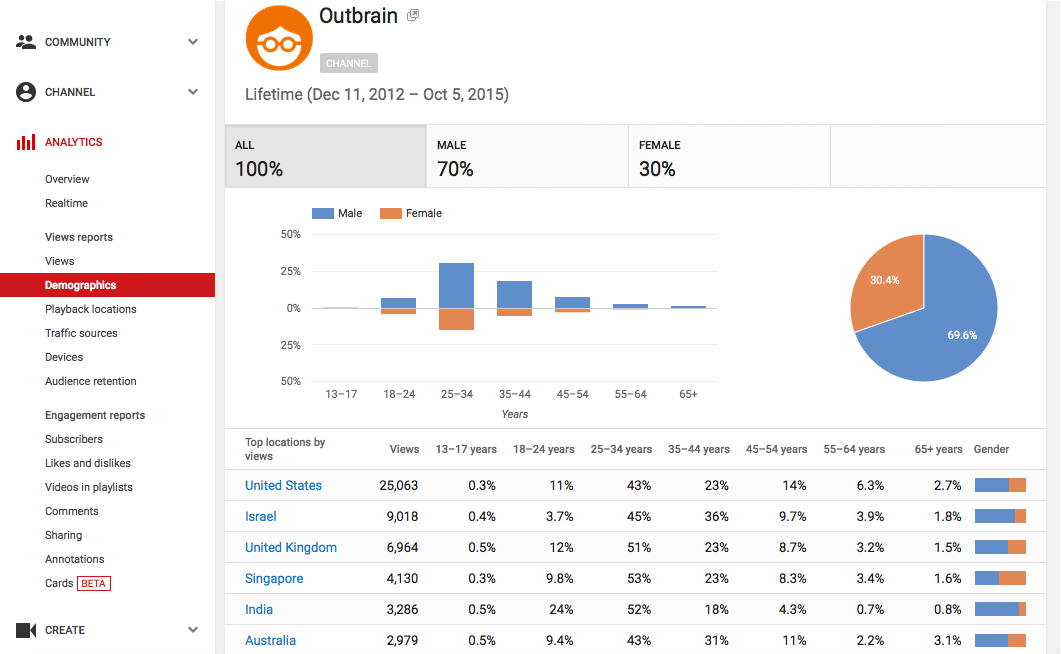
Using this report: To make sure you’re reaching the right audience, use this information to tailor your own videos.
Piggybacking off of the example above, if we wanted to capitalize on the engaged audience in Israel, we could either target content to that specific location through means of promotion, or make the content a little more appealing to that demographic.
Something we now consider when creating video content is offering subtitles and captions in Hebrew:
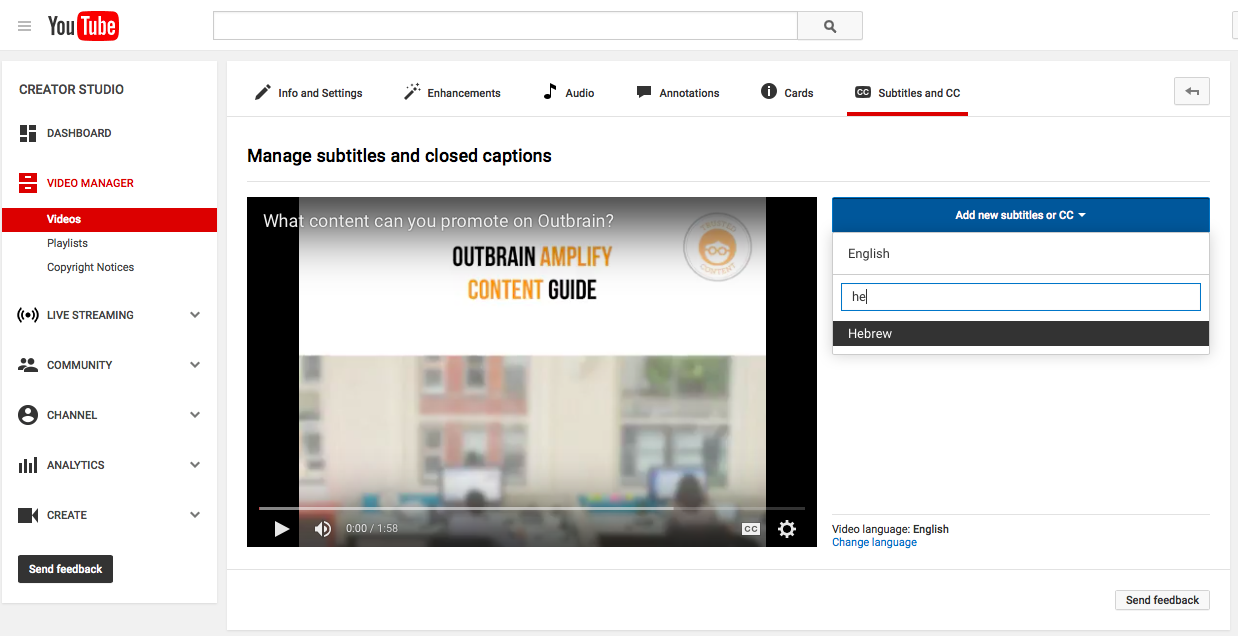
It may take a little more time to produce, but in the end, creates a better user experience, as content may not always be optimized for the other popular audiences you hold opportunity with.
Use this area of reporting to improve your visibility among untapped segments of viewers.
Subscribers
Subscriber count is the most basic metric you can look at, but it is also a crucial one for businesses looking to invest more in this platform.
Below is a screenshot of a subscriber’s report we ran with an added layer comparing published content:
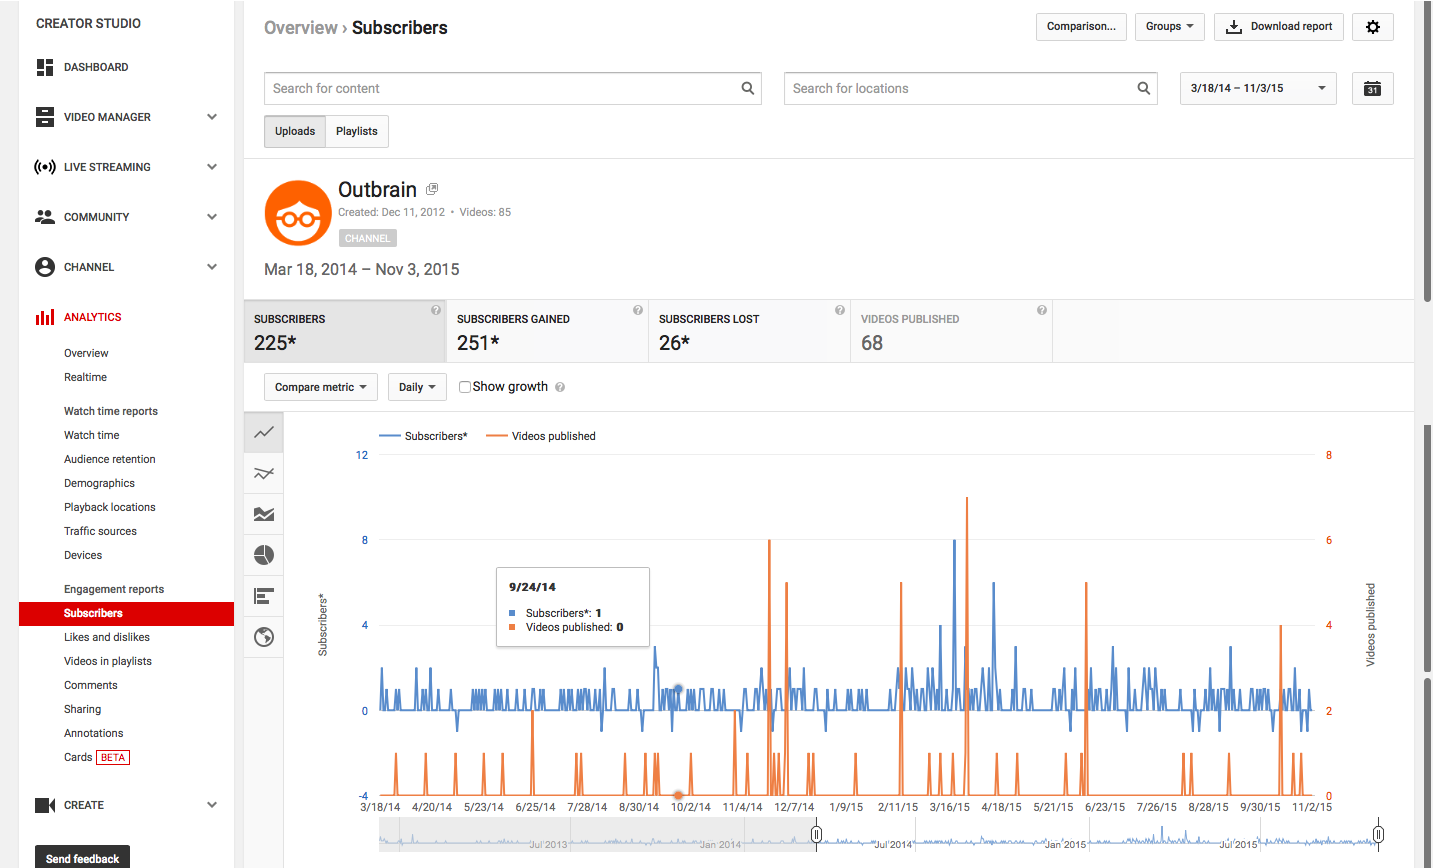
Using this feature: Following the growth of your subscribers is like following your ability to reach new audiences–as with any other platform.
As you gain subscribers, putting new video content out means getting people to click back to your channel from the feed, so be mindful of how frequently you are releasing content.
If you see a lull in subscribers, you might need to publish again soon.
Important: Notice that upticks in our subscriber count typically correlates to when new content has been published on the channel.
The more video views, the better your YouTube channel ranking. If you can create a following and get subscribers on a consistent schedule, you’ll keep people coming back for more.
If you don’t have an audience yet, discovery tools like Outbrain can help you amplify your video content across premium sites–which is an especially powerful strategy for video viewers who are already in consumption mode.
The Takeaway
In the end, as you train yourself to read and understand even the general analytics reports, the better you will become at producing engaging content.
We hope this behind the scenes look at our evolving YouTube channel will help you get more accustomed to reporting.
From there, you’ll begin to come up with more advanced tactics for how to increase viewership. Once you do, you can check out these 9 Advanced Tactics for Promoting Your YouTube Channel and Increasing Subscribers.
Do you have any more thoughts on reading your analytics or improving your YouTube engagement levels? Let us know your story and your thoughts in the comment section below.

